This is exactly the same function as scale_*_continuous, just with different
label defaults to save repetitively setting these parameters, except that
the parameters which you would normally find inside the scales::format_*()
functions are accessible directly in the scale_[xy]_*_cz() functions.
Usage
scale_x_percent_cz(
  name = waiver(),
  breaks = waiver(),
  minor_breaks = waiver(),
  guide = waiver(),
  n.breaks = NULL,
  labels,
  limits = NULL,
  expand = c(0.01, 0),
  oob = scales::censor,
  na.value = NA_real_,
  trans = "identity",
  position = "bottom",
  sec.axis = waiver(),
  accuracy = 1,
  scale = 100,
  prefix = "",
  suffix = " %",
  big.mark = " ",
  decimal.mark = ",",
  trim = TRUE,
  ...
)

scale_y_percent_cz(
  name = waiver(),
  breaks = waiver(),
  minor_breaks = waiver(),
  guide = waiver(),
  n.breaks = NULL,
  labels,
  limits = c(0, 1),
  expand = c(0.01, 0),
  oob = scales::censor,
  na.value = NA_real_,
  trans = "identity",
  position = "left",
  sec.axis = waiver(),
  accuracy = 1,
  scale = 100,
  prefix = "",
  suffix = " %",
  big.mark = " ",
  decimal.mark = ",",
  trim = TRUE,
  ...
)

scale_x_number_cz(
  name = waiver(),
  breaks = waiver(),
  minor_breaks = waiver(),
  guide = waiver(),
  n.breaks = NULL,
  labels,
  limits = NULL,
  expand = c(0.01, 0),
  oob = scales::censor,
  na.value = NA_real_,
  trans = "identity",
  position = "bottom",
  sec.axis = waiver(),
  accuracy = 1,
  scale = 1,
  prefix = "",
  suffix = "",
  big.mark = " ",
  decimal.mark = ",",
  trim = TRUE,
  ...
)

scale_y_number_cz(
  name = waiver(),
  breaks = waiver(),
  minor_breaks = waiver(),
  guide = waiver(),
  n.breaks = NULL,
  labels,
  limits = NULL,
  expand = c(0.01, 0),
  oob = scales::censor,
  na.value = NA_real_,
  trans = "identity",
  position = "left",
  sec.axis = waiver(),
  accuracy = 1,
  scale = 1,
  prefix = "",
  suffix = "",
  big.mark = " ",
  decimal.mark = ",",
  trim = TRUE,
  ...
)
Arguments
- name
The name of the scale. Used as axis or legend title. If
waiver(), the default, the name of the scale is taken from the first mapping used for that aesthetic. IfNULL, the legend title will be omitted.- breaks
One of:
NULLfor no breakswaiver()for the default breaks computed by the transformation objectA numeric vector of positions
A function that takes the limits as input and returns breaks as output
- minor_breaks
One of:
NULLfor no minor breakswaiver()for the default breaks (one minor break between each major break)A numeric vector of positions
A function that given the limits returns a vector of minor breaks.
- guide
guide A function used to create a guide or its name. See
guides()for more information.- n.breaks
An integer guiding the number of major breaks. The algorithm may choose a slightly different number to ensure nice break labels. Will only have an effect if
breaks = waiver(). Use NULL to use the default number of breaks given by the transformation.- labels
Specifying overrides the default format (i.e. you really don't want to do that).
NULLmeans no labels.- limits
A numeric vector of length two providing limits of the scale. Use
NAto refer to the existing minimum or maximum.- expand
same as in ggplot2
- oob
Function that handles limits outside of the scale limits (out of bounds). The default replaces out of bounds values with NA.
- na.value
If
na.translate = TRUE, what value aesthetic value should missing be displayed as? Does not apply to position scales whereNAis always placed at the far right.- trans
(DEPRECATED) Either the name of a transformation object, or the object itself. Built-in transformations include "asn", "atanh", "boxcox", "exp", "identity", "log", "log10", "log1p", "log2", "logit", "probability", "probit", "reciprocal", "reverse" and "sqrt".
- position
The position of the axis. "left" or "right" for vertical scales, "top" or "bottom" for horizontal scales
- sec.axis
specify a secondary axis
- accuracy, scale, prefix, suffix, big.mark, decimal.mark, trim
See [scales::comma_format()] or [scales::percent_format()]
- ...
passed on to [scales::comma_format()] or [scales::percent_format()]
Examples
# ADD_EXAMPLES_HERE
library(reschola)
library(ggplot2)
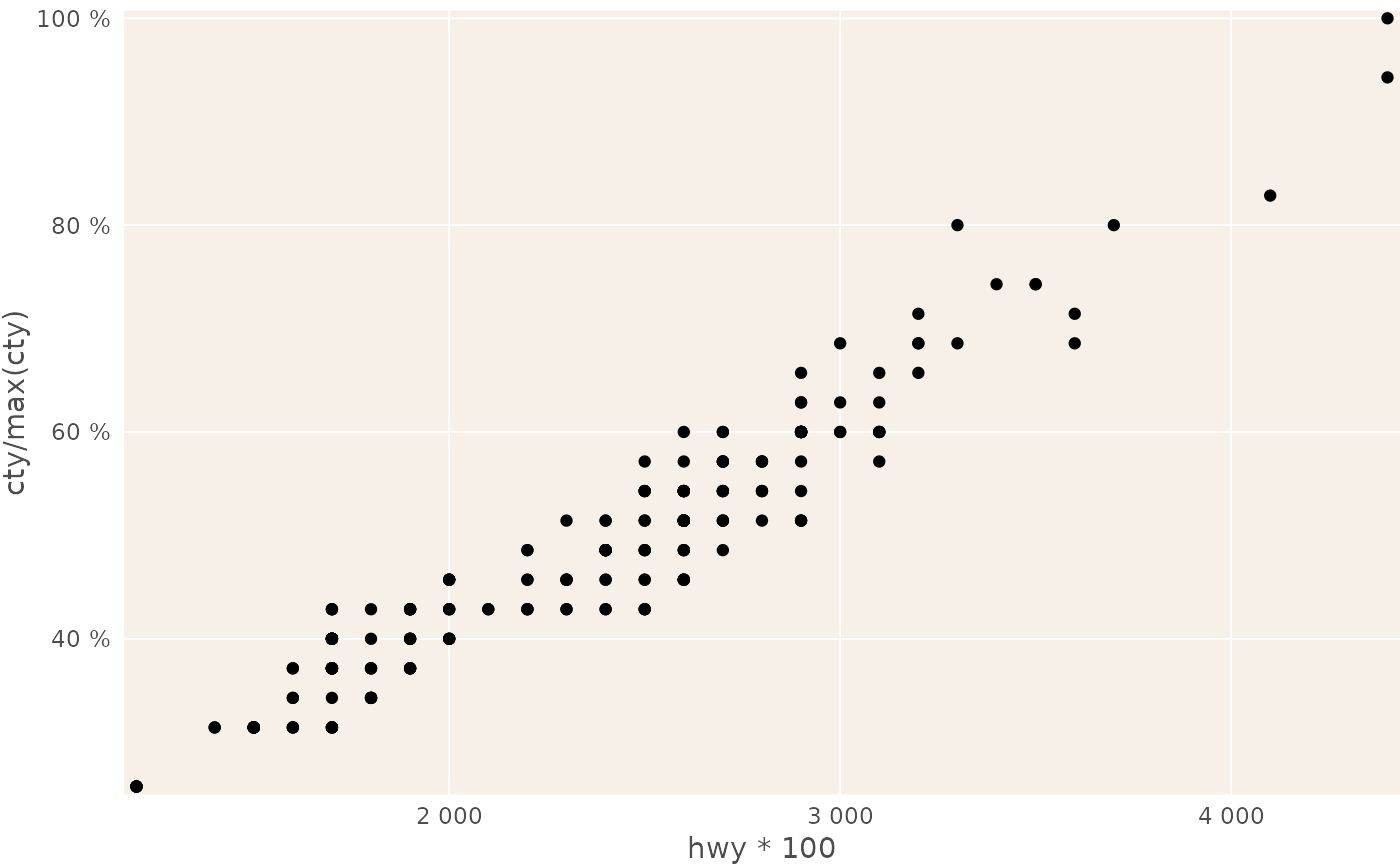
ggplot(mpg, aes(hwy * 100, cty / max(cty))) +
  geom_point() +
  theme_schola(family = "sans", title_family = "sans", gridlines = "scatter") +
  scale_y_percent_cz() +
  scale_x_number_cz()
